Support and Resistance
The strongest of all trading tools for the technical trader is support and resistance. The single greatest asset for gaining an edge over the market is the understanding of price and the critical junctures of price where the forces of supply and demand meet. The best way we can do this is through the use of support and resistance.
What Is Support?
Support is the price level where demand is believed to be strong enough to prevent the price of a financial asset from declining further. The logic behind this is as the price falls towards a realized support level, buyers will be attracted to the cheaper price of the financial asset, plus they will have the emotional confidence that demand is strong enough to support the asset from falling any further. Thus traders will be more inclined to buy rather than sell.

What is Resistance?
Resistance is the price level at which selling is believed to be strong enough to prevent the price from rising further. The logic behind this is as the price rises towards a realized resistance level, a trader will feel the cost of the asset is too expensive, and fewer ” new buyers ” will be attracted to the inflated price of the asset. Thus traders are more inclined to sell rather than buy.
Establishing Price
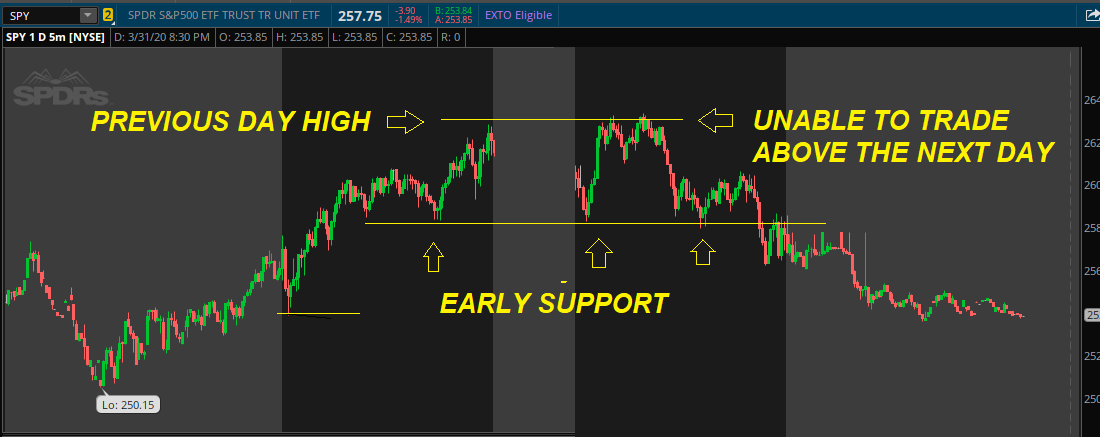
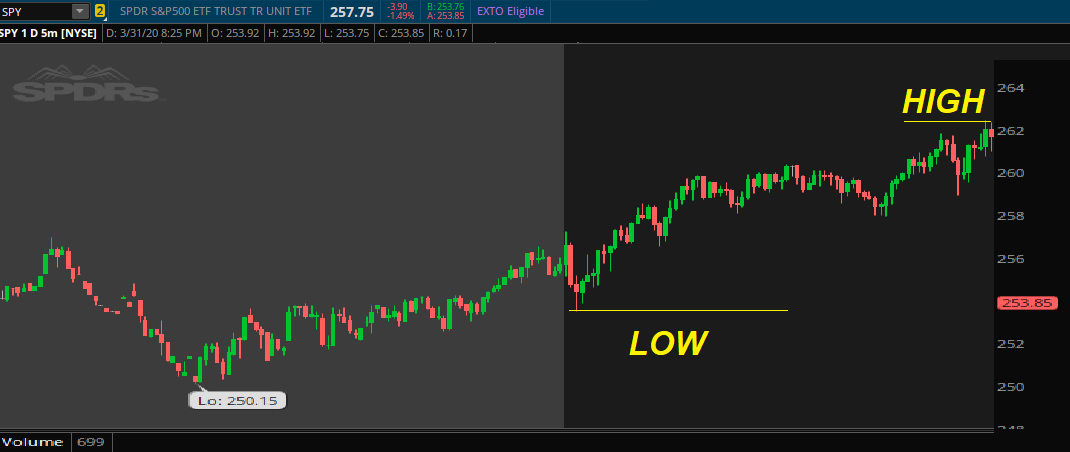
A good starting point for support and resistance is, to begin with, the high and the low of the previous trading day. Below you will see a chart of the SPY ( S&P 500 ) for March 30th, 2020, where the low of that day was $253.50, and the high of that day was $262.50. Often an asset can trade above and below support and resistance, but to make this demonstration simpler try to think that the closer the price gets to $253.50 the following day, the more traders will be inclined to buy, and the closer it gets to $262.50 the more traders will be inclined to sell.

Trading Off Support And Resistance
As mentioned above, the closer you get to support, the more inclined you should be to buy, and the closer you get to resistance, the more inclined you should be to sell. So a trader could buy as close to $258 and sell close to $262. Also, as the price approaches $262, a trader could short sale ( profit on the declining asset price) and cover ( buying back the sold shares ) at $258. There is more to trading than that, and in a real-time environment it is not so black and white, but the main takeaway from this is two things.
- To make any money at all on a trade, you have to be on the right side of it. Support and resistance gives you a straight forward look as to who is in control of the stock, bulls, or bears. Being on the right side of the trade and capturing the trend is where the real money is made.
- Stock and assets usually do not trade at random numbers; they trade from one price level to the next. One of the recipes for self-destruction in the trading world is taking small profits and letting losing trades get out of control. By using basic support and resistance, you can maximize your profits as well as manage your losses.
Resistance Becomes Support And Support Becomes Resistance
Another technical analysis formula is that support can turn into resistance and vice versa. Once the price breaks below a support level, the broken support level can turn into resistance. The break of support signals that supply has overcome the demand. On the other hand, when resistance is broken, demand has overwhelmed the supply. It will be at these levels where you will typically see abrupt, fast moves in an asset price. If you look to the far right of the SPY chart once the support of $258 was broken, the SPY quickly drops $2 in price. The reason for this is two forces have connected at the same time on the chart. The buyers have sold as support was broken, and short-sellers have entered a selling position there.